পরিসংখ্যানে পার্সেন্টাইল (Percentiles) কী?
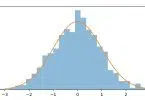
পার্সেন্টাইল (Percentiles) হলো একটি পরিসংখ্যানগত ধারণা যা মেশিন লার্নিংয়ে একটি ডেটাসেটের বন্টন বর্ণনা করতে ব্যবহৃত হয়। একটি পার্সেন্টাইল হলো এমন একটি পরিমাপ যা একটি নির্দিষ্ট শতাংশ পর্যবেক্ষণ একটি পর্যবেক্ষণ গোষ্ঠীর নিচে থাকে তা নির্দেশ করে।
২৫তম পার্সেন্টাইল (যা প্রথম কোয়ার্টাইল নামেও পরিচিত) হলো সেই মান যার নিচে ডেটাসেটের ২৫% পর্যবেক্ষণ পড়ে, যেখানে ৭৫তম পার্সেন্টাইল (যা তৃতীয় কোয়ার্টাইল নামেও পরিচিত) হলো সেই মান যার নিচে ডেটাসেটের ৭৫% পর্যবেক্ষণ পড়ে।
পার্সেন্টাইলগুলো একটি ডেটাসেটের বন্টনকে সারসংক্ষেপ করতে এবং আউটলায়ার (outlier) সনাক্ত করতে ব্যবহার করা যেতে পারে। মেশিন লার্নিংয়ে, ডেটা প্রিপ্রসেসিং এবং এক্সপ্লোরেটরি ডেটা অ্যানালাইসিসে ডেটা সম্পর্কে ধারণা পেতে প্রায়শই পার্সেন্টাইল ব্যবহার করা হয়। পাইথনে NumPy এবং Pandas সহ পার্সেন্টাইল গণনার জন্য বেশ কয়েকটি লাইব্রেরি রয়েছে।
NumPy ব্যবহার করে উদাহরণ
নিম্নে কিভাবে NumPy ব্যবহার করে পার্সেন্টাইল গণনা করা যায় তার একটি উদাহরণ দেওয়া হলো:
|
1 2 3 4 5 6 7 8 9 10 11 |
import numpy as np data = np.array([1, 2, 3, 4, 5]) p25 = np.percentile(data, 25) p75 = np.percentile(data, 75) print('25th percentile:', p25) print('75th percentile:', p75) |
এই উদাহরণে, আমরা NumPy ব্যবহার করে একটি নমুনা ডেটাসেট তৈরি করি এবং তারপর np.percentile() ফাংশন ব্যবহার করে ২৫তম ও ৭৫তম পার্সেন্টাইল গণনা করি।
পান্ডাস ব্যবহার করে উদাহরণ
পান্ডাস (Pandas) ব্যবহার করে কীভাবে পার্সেন্টাইল গণনা করা যায় তার একটি উদাহরণ নিচে দেওয়া হলো:
|
1 2 3 4 5 6 7 8 9 10 11 |
import pandas as pd data = pd.Series([1, 2, 3, 4, 5]) p25 = data.quantile(0.25) p75 = data.quantile(0.75) print('25th percentile:', p25) print('75th percentile:', p75) |
এই উদাহরণে, আমরা একটি পান্ডাস সিরিজ অবজেক্ট তৈরি করি এবং তারপর সেই সিরিজ অবজেক্টের quantile() পদ্ধতি ব্যবহার করে ২৫তম ও ৭৫তম পার্সেন্টাইল গণনা করি।
AI ইঞ্জিনিয়ারিংয়ে পার্সেন্টাইল কেন গুরুত্বপূর্ণ?
AI ইঞ্জিনিয়ারিংয়ে পার্সেন্টাইল বিভিন্ন কারণে অত্যন্ত গুরুত্বপূর্ণ:
-
ডেটা ডিস্ট্রিবিউশন বোঝা (Understanding Data Distribution): পার্সেন্টাইল ডেটাসেটের বন্টন সম্পর্কে একটি দ্রুত ধারণা দেয়। উদাহরণস্বরূপ, যদি আপনি একটি ফিচারের ৯০তম পার্সেন্টাইল দেখেন, তাহলে আপনি জানতে পারবেন যে ৯০% ডেটা সেই মানের নিচে পড়ে, যা ডেটার ঘনত্ব এবং বিন্যাস বুঝতে সাহায্য করে।
-
আউটলায়ার সনাক্তকরণ (Outlier Detection): পার্সেন্টাইল ব্যবহার করে আউটলায়ার বা অস্বাভাবিক মান সহজে সনাক্ত করা যায়। যখন কোনো ডেটা পয়েন্ট খুব উচ্চ বা খুব নিম্ন পার্সেন্টাইলের বাইরে থাকে (যেমন ১ম পার্সেন্টাইলের নিচে বা ৯৯তম পার্সেন্টাইলের উপরে), তখন সেটিকে আউটলায়ার হিসাবে বিবেচনা করা যেতে পারে। আউটলায়ারগুলি প্রায়শই ডেটা অ্যানালিসিস এবং মডেল ট্রেনিংয়ের ক্ষেত্রে সমস্যা তৈরি করে।
-
ফিচার স্কেলিং এবং নরমালাইজেশন (Feature Scaling and Normalization): মেশিন লার্নিং মডেলগুলিকে আরও ভালোভাবে কাজ করানোর জন্য ডেটা স্কেল করা বা নরমালাইজ করা প্রায়শই প্রয়োজন হয়। পার্সেন্টাইল-ভিত্তিক স্কেলিং পদ্ধতিগুলি (যেমন রবাস্ট স্কেলিং) আউটলায়ারগুলির প্রতি কম সংবেদনশীল, যা ডেটার বিতরণকে আরও স্থিতিশীল করে তোলে।
-
মডেল পারফরম্যান্স মূল্যায়ন (Model Performance Evaluation): শ্রেণীবিন্যাস (classification) বা রিগ্রেশন (regression) মডেলগুলির পারফরম্যান্স মূল্যায়নে পার্সেন্টাইল ব্যবহার করা যেতে পারে। উদাহরণস্বরূপ, পূর্বাভাসিত ত্রুটির পার্সেন্টাইল দেখে মডেলের নির্ভুলতার একটি স্পষ্ট চিত্র পাওয়া যায়।
-
হাইপারপ্যারামিটার টিউনিং (Hyperparameter Tuning): কিছু মডেলের হাইপারপ্যারামিটারগুলি ডেটা বন্টনের উপর ভিত্তি করে সেট করা যেতে পারে, যেখানে পার্সেন্টাইলের ধারণা কাজে লাগে।
-
ডাটা প্রিপ্রসেসিং এবং এক্সপ্লোরেটরি ডেটা অ্যানালিসিস (Data Preprocessing and Exploratory Data Analysis – EDA): EDA চলাকালীন, পার্সেন্টাইলগুলি ডেটার মৌলিক পরিসংখ্যানগত বৈশিষ্ট্য এবং সম্ভাব্য প্যাটার্নগুলি বুঝতে সাহায্য করে। ডেটা ক্লিনিং এবং রূপান্তরের জন্য এটি একটি গুরুত্বপূর্ণ ধাপ।
সংক্ষেপে, পার্সেন্টাইল AI ইঞ্জিনিয়ারিংয়ে ডেটা বুঝতে, প্রস্তুত করতে এবং মডেলের পারফরম্যান্স মূল্যায়ন করতে একটি মৌলিক এবং কার্যকরী টুল হিসাবে কাজ করে।


Leave a Comment