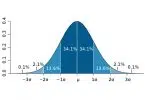
ডেটা অ্যানালাইসিসের সময় আমাদের প্রায়ই হাজার হাজার ডেটা পয়েন্ট নিয়ে কাজ করতে হয়। এত বিশাল ডেটাসেট থেকে অর্থপূর্ণ তথ্য বের করার প্রথম ধাপ হলো ডেটার একটি “সাধারণ” বা “কেন্দ্রীয়” মান খুঁজে বের করা। এই কেন্দ্রীয় মান বের করার পদ্ধতিগুলোকেই বলা হয় Measures of Central Tendency। সহজ কথায়, এই পদ্ধতিগুলো আমাদের বলে দেয় ডেটাসেটের বেশিরভাগ মান কোন সংখ্যাটির কাছাকাছি অবস্থান করছে।
গড় (Mean), মধ্যমা (Median) এবং প্রচুরক (Mode) হলো ডেটাসেটের কেন্দ্রীয় প্রবণতা (central tendency) বর্ণনা করতে ব্যবহৃত মৌলিক পরিসংখ্যানগত সরঞ্জাম বা উপাদান—অর্থাৎ, যেখানে বেশিরভাগ মান কেন্দ্রীভূত থাকে। এআই ইঞ্জিনিয়ারিংয়ে, এই পরিমাপগুলি ডেটা কীভাবে ছড়িয়ে আছে তা বুঝতে সাহায্য করে এবং আউটলায়ার (অস্বাভাবিক মান যা প্যাটার্নের সাথে মেলে না) সনাক্ত করতেও সহায়তা করতে পারে।
নিম্নলিখিত বিভাগগুলিতে, আমরা প্রতিটি পরিমাপের অর্থ এবং পাইথন ব্যবহার করে কীভাবে এটি গণনা করতে হয় তা অন্বেষণ করব।
গড় (Mean)
গড় (Mean) হলো একগুচ্ছ সংখ্যার গড় মান। এটি বের করতে, আপনাকে ডেটাসেটের সমস্ত মান একসাথে যোগ করতে হবে এবং তারপর মোট যোগফলকে মোট মানের সংখ্যা দিয়ে ভাগ করতে হবে। তবে ব্যবহারের ওপর ভিত্তি করে গড়ের বিভিন্ন প্রকারভেদ রয়েছে।
পাটিগাণিতিক গড় (Arithmetic Mean)
এটিই সবচেয়ে সাধারণ গড়। আমরা ডেটাসেটের সমস্ত মান যোগ করে মোট মানের সংখ্যা দিয়ে ভাগ করলেই এই গড় পেয়ে যাই। সাধারণ যেকোনো নিউমেরিক্যাল ডেটাসেটের কেন্দ্রীয় মান বের করার জন্য এটি ব্যবহৃত হয়। তবে ডেটাসেটে যদি খুব বড় বা খুব ছোট কোনো আউটলায়ার (Outlier) বা অস্বাভাবিক মান থাকে, তবে এই গড়টি প্রভাবিত হতে পারে।
|
1 2 3 4 5 6 7 8 |
import numpy as np marks = [80, 85, 90, 75, 70] arithmetic_mean = np.mean(marks) print(f"পাটিগাণিতিক গড় (Arithmetic Mean): {arithmetic_mean}") |
ভারযুক্ত গড় (Weighted Mean)
যখন ডেটাসেটের কিছু মানের গুরুত্ব অন্যদের চেয়ে বেশি হয়, তখন আমরা ওয়েটেড গড় ব্যবহার করি। এখানে প্রতিটি মানকে তার গুরুত্ব বা ‘weight’ দিয়ে গুণ করে তারপর যোগ করা হয় এবং সবশেষে মোট ‘weight’ দিয়ে ভাগ করা হয়। বিশ্ববিদ্যালয়ের সিজিপিএ (CGPA) গণনা করার সময় এটি খুব ব্যবহৃত হয়, যেখানে প্রতিটি কোর্সের ক্রেডিট (credit) তার ওয়েট হিসেবে কাজ করে।
|
1 2 3 4 5 6 7 8 9 10 |
import numpy as np grades = [4.0, 3.0] # গ্রেড পয়েন্ট credits = [3, 2] # কোর্স ক্রেডিট (ওয়েট) weighted_mean = np.average(grades, weights=credits) print(f"ভারযুক্ত গড় (Weighted Mean): {weighted_mean:.2f}") |
হারমোনিক গড় (Harmonic Mean)
হারমোনিক গড় সাধারণত গতিবেগ (speed), হার (rate) বা অনুপাতের গড় বের করার জন্য ব্যবহৃত হয়। যখন আপনি বিভিন্ন গতিবেগে সমান দূরত্ব অতিক্রম করার গড় গতিবেগ বের করতে চান। যখন আপনি বিভিন্ন গতিবেগে সমান দূরত্ব অতিক্রম করার গড় গতিবেগ বের করতে চান।
|
1 2 3 4 5 6 7 8 |
from scipy.stats import hmean speeds = [60, 40] # কিমি/ঘণ্টা harmonic_mean = hmean(speeds) print(f"হারমোনিক গড় (Harmonic Mean): {harmonic_mean:.2f} km/h") |
জ্যামিতিক গড় (Geometric Mean)
জ্যামিতিক গড় সাধারণত ডেটা যখন গুণ আকারে বাড়ে (multiplicative series), যেমন ইনভেস্টমেন্টের রিটার্ন বা চক্রবৃদ্ধি হারের গড় বের করতে ব্যবহৃত হয়। বিভিন্ন বছরের ইনভেস্টমেন্ট রিটার্নের গড় হার বা জনসংখ্যা বৃদ্ধির গড় হার বের করার জন্য।
|
1 2 3 4 5 6 7 8 9 10 11 12 |
from scipy.stats import gmean growth_factors = [1.20, 0.90] geometric_mean = gmean(growth_factors) # গড় বৃদ্ধির হার শতাংশে প্রকাশ average_growth_rate = (geometric_mean - 1) * 100 print(f"জ্যামিতিক গড় (Geometric Mean): {geometric_mean:.3f}") print(f"গড় বৃদ্ধির হার: {average_growth_rate:.2f}%") |
মধ্যমা (Median)
- বিজোড় সংখ্যা: ডেটাসেটে যদি বিজোড় সংখ্যক মান থাকে (যেমন ৫টি), তবে মাঝখানের মানটিই Median। (10, 20, 30, 40, 50) -> Median হলো 30।
- জোড় সংখ্যা: ডেটাসেটে যদি জোড় সংখ্যক মান থাকে (যেমন ৬টি), তবে মাঝের দুটি মানের গড় হলো Median। (10, 20, 30, 40, 50, 60) -> Median হলো 30+40/2 = 35।
|
1 2 3 4 5 6 7 8 9 10 11 12 13 14 |
import numpy as np import pandas as pd # create a sample salary table salary = pd.DataFrame({ 'employee_id': ['001', '002', '003', '004', '005', '006', '007', '008', '009', '010'], 'salary': [50000, 65000, 55000, 45000, 70000, 60000, 55000, 45000, 80000, 70000] }) # calculate median median_salary = np.median(salary['salary']) print('Median salary:', median_salary) |
প্রচুরক (Mode)
প্রচুরক (Mode) হলো সেই মান যা কোনো একটি ডেটাসেটে সবচেয়ে বেশি সংখ্যকবার দেখা যায়। এটি খুঁজে বের করার জন্য, আপনাকে কেবল সেই সংখ্যাটি দেখতে হবে যা সবচেয়ে বেশিবার ঘটেছে।
- যদি দুটি মান সমান সংখ্যকবার দেখা যায়, তাহলে সেটিকে বাইমোডাল (bimodal) বলে।
- যদি তিনটি মান সমানভাবে পুনরাবৃত্তি হয়, সেটিকে ট্রাইমোডাল (trimodal) বলে।
- তিনটির বেশি মান সমান সংখ্যায় পুনরাবৃত্তি হলে সেটিকে মাল্টিমোডাল (multimodal) বলে।
প্রচুরক (Mode) আমাদেরকে বুঝতে সাহায্য করে কোন মানটি সবচেয়ে সাধারণ বা বেশি দেখা যায়, যা কিছু পরিস্থিতিতে উপযোগী হতে পারে। তবে, যদি ডেটাতে কোনও পুনরাবৃত্ত মান না থাকে বা মানগুলি খুব বেশি ছড়িয়ে থাকে তবে এটি খুব সহায়ক নাও হতে পারে। পাইথনে, আমরা SciPy লাইব্রেরি ব্যবহার করে মোড গণনা করতে পারি, যেখানে mode() নামক একটি ফাংশন রয়েছে।
|
1 2 3 4 5 6 7 8 9 10 11 12 13 14 |
import numpy as np import pandas as pd # create a sample salary table salary = pd.DataFrame({ 'employee_id': ['001', '002', '003', '004', '005', '006', '007', '008', '009', '010'], 'salary': [50000, 65000, 55000, 45000, 70000, 60000, 55000, 45000, 80000, 70000] }) # calculate mode mode_salary = salary['salary'].mode() print('Mode salary:', mode_salary.tolist()) |


Leave a Comment